amdgpu_top: A Modern radeontop Alternative
I’ve been using a tool called radeontop for years to monitor the performance and utilization of my AMD GPUs on Linux. It’s a TUI-based application that renders the value of different performance counters as bar charts:
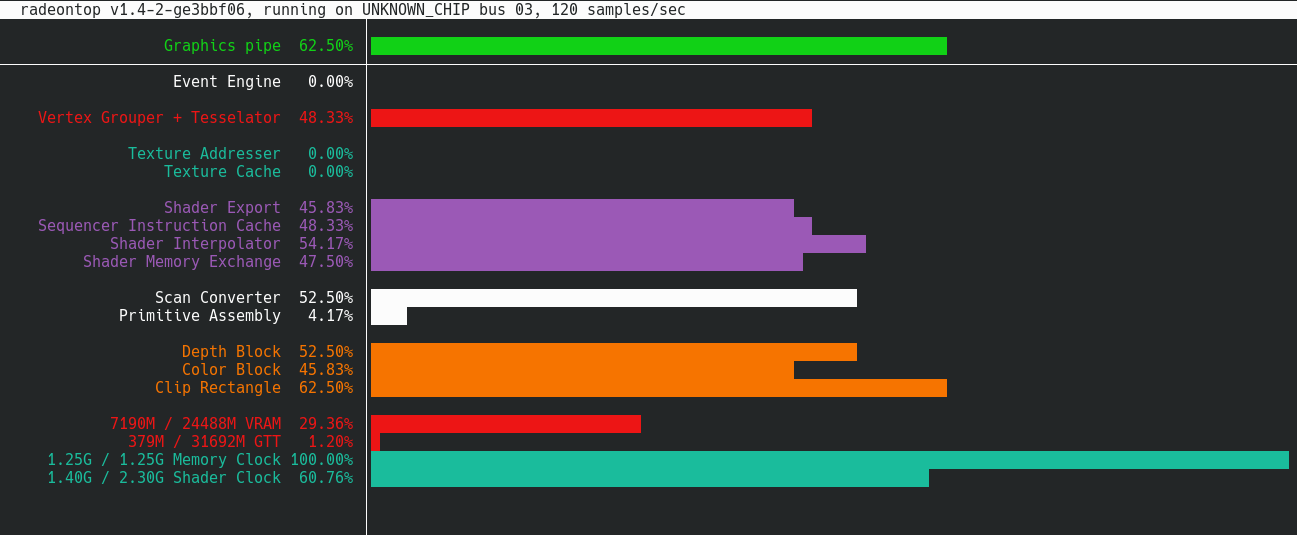
For the most part, it does a good job and it provides a concise overview of GPU utilization.
However, it seems that
radeontopis no longer actively developed/updated.
It’s received ~7 commits in the past ~3 years and it does still mostly work even with the latest GPUs like the 7900 XTX, but it’s not under active development.
Enter amdgpu_top⌗
Today, I discovered an alternative tool that does all of the same things as radeontop and more: amdgpu_top. It’s actively developed with commits in the past couple of weeks at the time of writing this.
It is written in Rust, and so was extremely easy to install:
cargo install amdgpu_top
Here’s what its UI looks like:
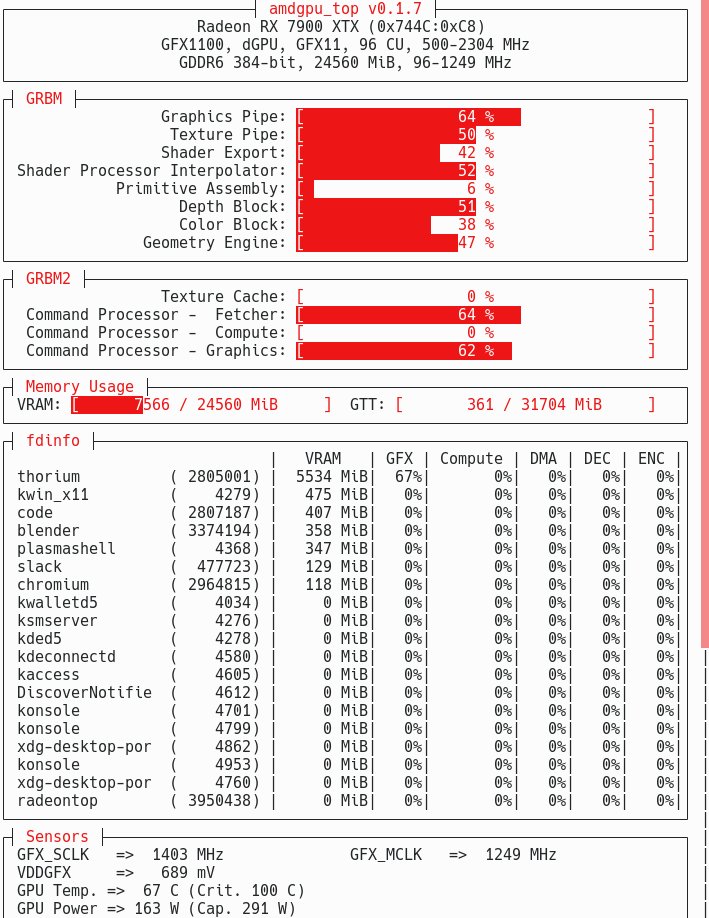
As you can see, there’s a ton more data available! One immediate benefit is the process list which shows which processes are consuming what GPU resources. This is extremely useful and something I had no ability to see with radeontop.
The sensors view is also extremely useful. radeontop had no way to track GPU temperature, but here amdgpu_top provides that along with clock rates, power metrics, and more.
For the displayed performance counters, I think they’re using the same underlying data with some differences in naming and grouping. I think that radeontop is slightly more granular with the performance counters, but I honestly have no idea what half of those counters even track so having a bit of a coarser view is actually beneficial to me.
GUI View⌗
Another big upgrade that amdgpu_top provides is a fully-fledged GUI application as an alternative to their default TUI view. It can be accessed by launching amdgpu_top --gui:
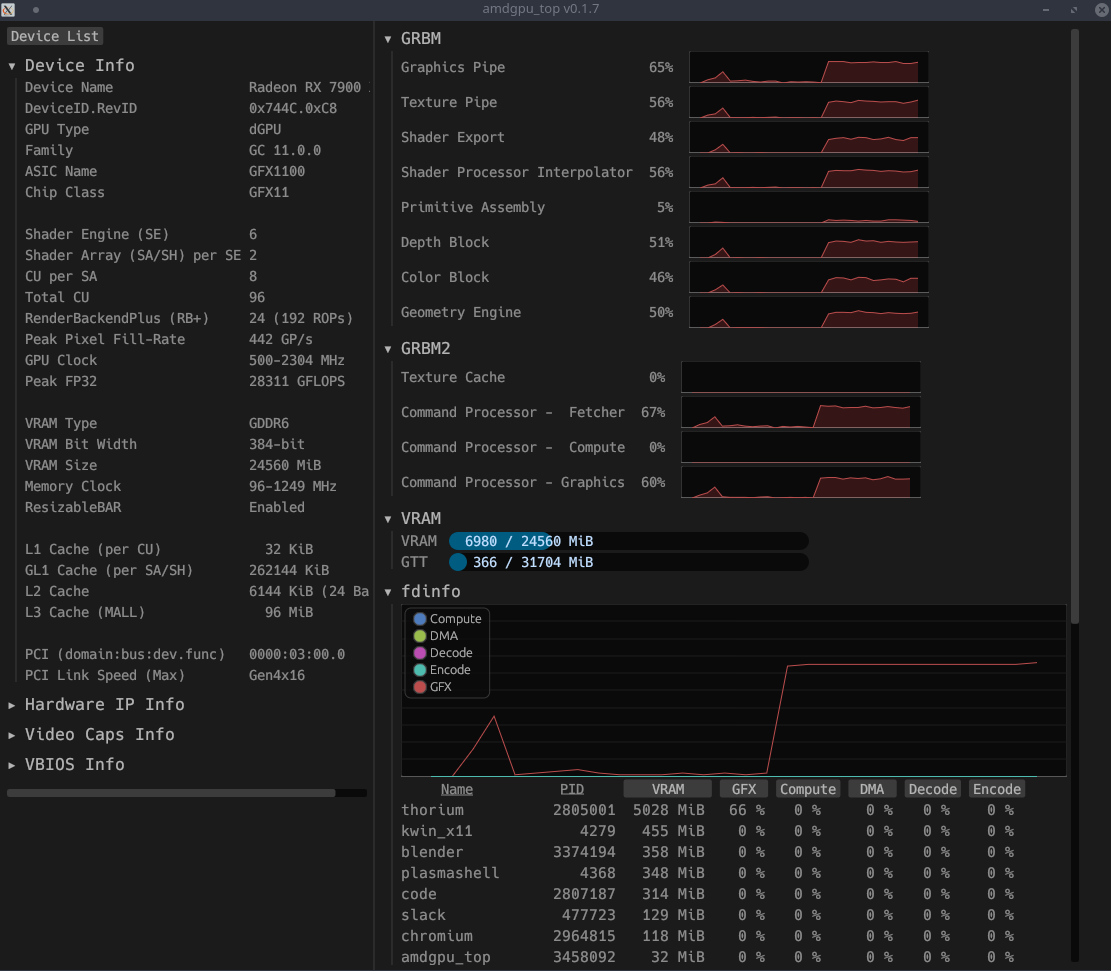
It’s quite dense, but that’s because it’s packed with so much information. Having the ability to track GPU utilization over time is a hugely useful feature, and as such I’ll probably end up using the GUI mode most often when I use amdgpu_top.
Conclusion⌗
So yeah, personally I see no way at all in which radeontop wins over amdgpu_top. amdgpu_top seems like a clear upgrade in every way, and I’ll not be looking back personally.
I’ll admit that as an avid Rust programmer, I’m slightly biased since amdgpu_top is written in Rust and radeontop is in C, but even besides that it’s just a better, more feature-rich, and modern tool.
If you’re interested in tracking performance for your AMD GPU, give amdgpu_top a try for sure!