Cryptoviz

Overview
In financial markets with buyers and sellers, there's something called an Order Book which contains the number of units of all pending offers to buy and sell assets at every price level. This order book can be in many ways, but most only show the state of the book at a single point in time.
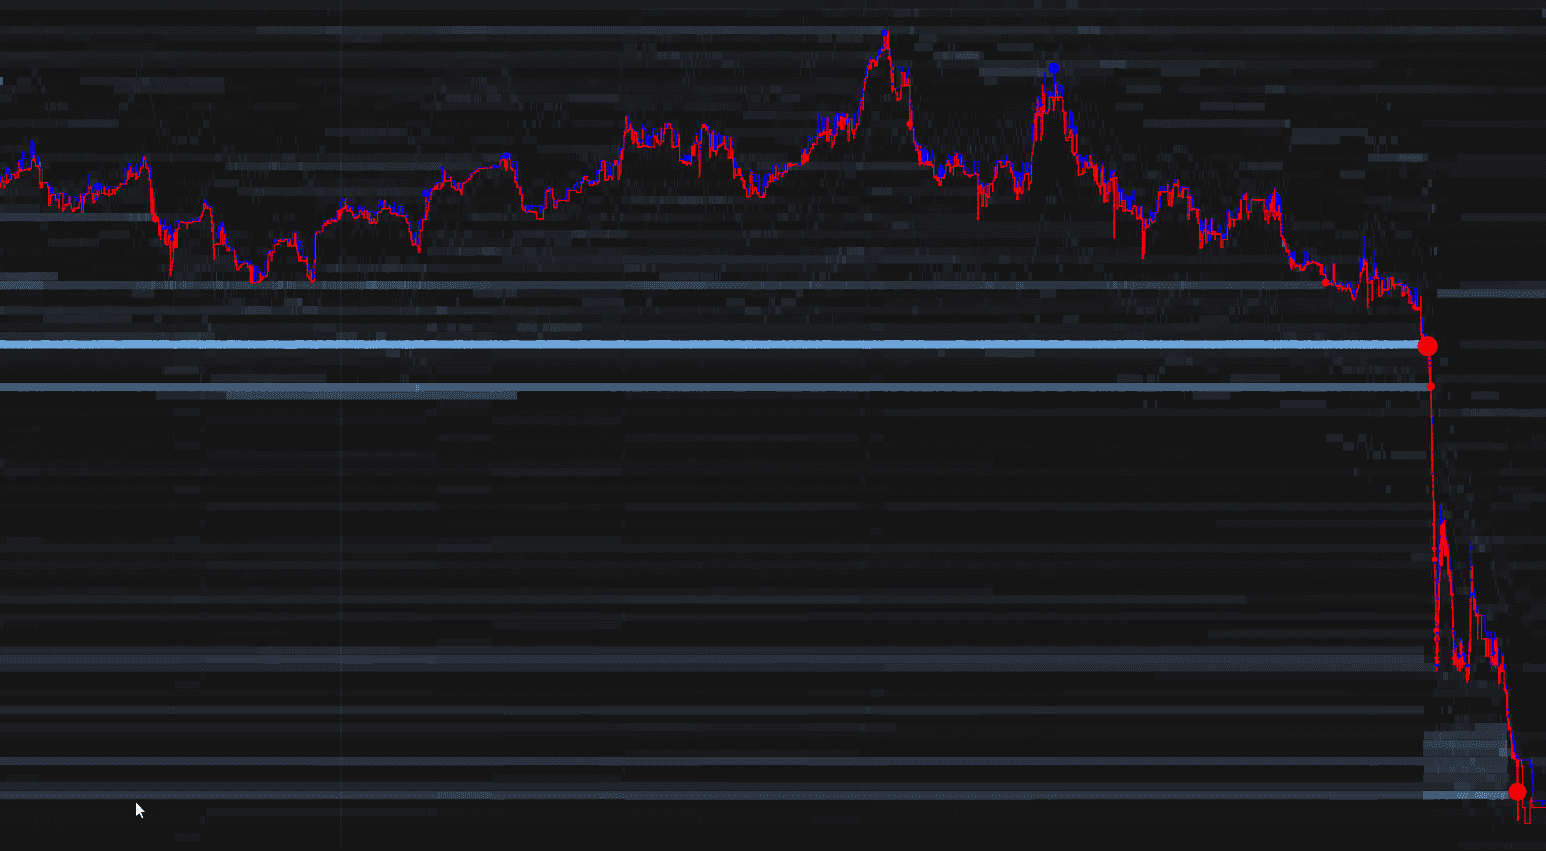
Cryptoviz allows users to visualize the state of the orderbook as it changes, recording the behavior of market participants and making their effects on the orderbook visible.
Technical Info
Cryptoviz was built using the Canvas2D API along with a library called PaperJS. The red and blue lines and circles along with the lines and axis labels were drawn with PaperJS, while the white lines in the background were drawn using the Canvas2D API directly.
For the data used to power the visualization, a direct WebSocket feed is opened to the Poloniex exchange's orderbook update feed. To start, these updates are recorded in an array and not applied to the visualization. Once that happens, a HTTP request is made to their public REST API to fetch the current state of the orderbook. The response from that contains a sequence number which can be used to pick the exact point at which to start applying orderbook updates; all recorded updates before the sequence number of the orderbook snapshot are discarded, and the ones after are applied.
By following this procedure, a virtual orderbook is maintained matching the state of the actual orderbook on the exchange. Some extra logic is added to try to handle WebSocket feed disconnections, preventing messages from being applied out-of-order. Book modifications and trades are plotted on the canvas until it reaches the right side, at which point the entire history is re-rendered with a smaller zoom. The same thing is used when users manually zoom in by selecting a region with the mouse: A subsection of the history is rendered from left to right and composited on the canvas. Since the visualization always grows to the right, there is no need to re-render the entire thing every update; instead, new data can be added directly.
Results + Interesting Observations
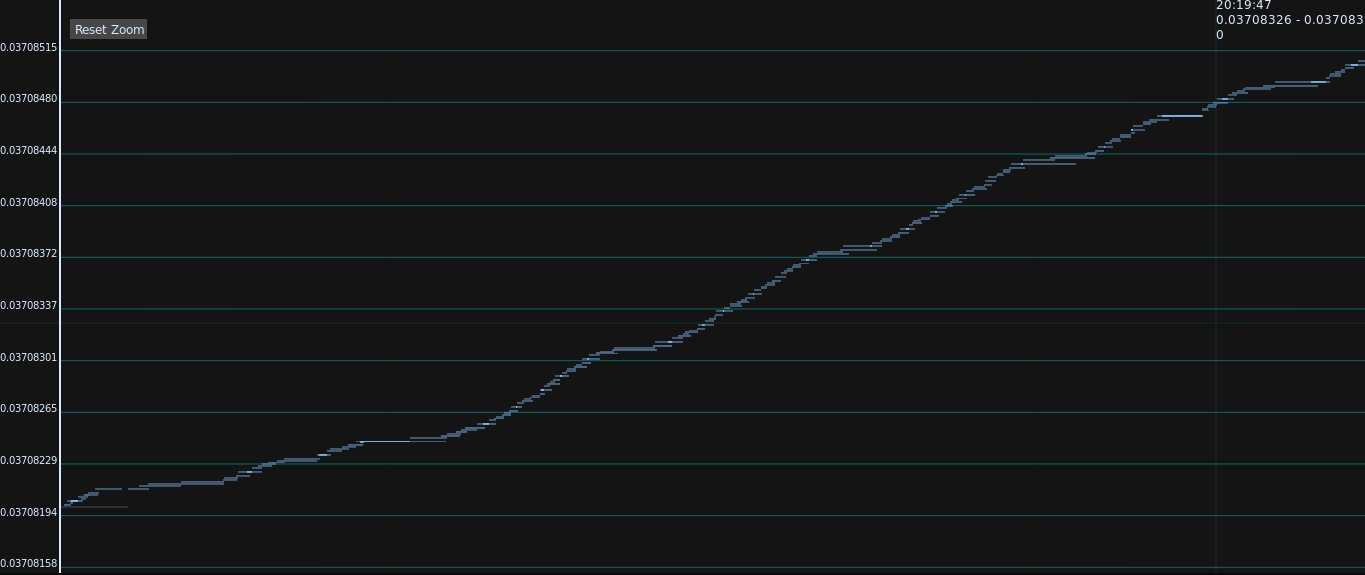
I wasn't 100% sure what kind of results to expect when building this tool. I had been interested in financial markets and in particular the way in which automated strategies contribute to market activity, and Cryptoviz makes these kinds of behaviors very clear. As it turned out, Cryptoviz was great at both visually analyzing activity that was difficult of impossible to see otherwise such as algorithmic trading patterns as well as analyzing the impact of large-scale market events.
I created a Twitter account (@cryptoviznet) to showcase interested market events captured with Cryptoviz. Here are some of the images I posted there:


All in all, I see Cryptoviz as one of my most interesting and successful projects. Although based on tools that already existed for the stock market, I feel that I created something genuinely useful and did so effectively. Data visualization is something I've always enjoyed, and getting to do so in such a unique was was a great experience. Many things I learned while building it have been useful for other projects, and the process introduced me to a lot of new ideas.