Drawing Graphviz Edge Splines
Background⌗
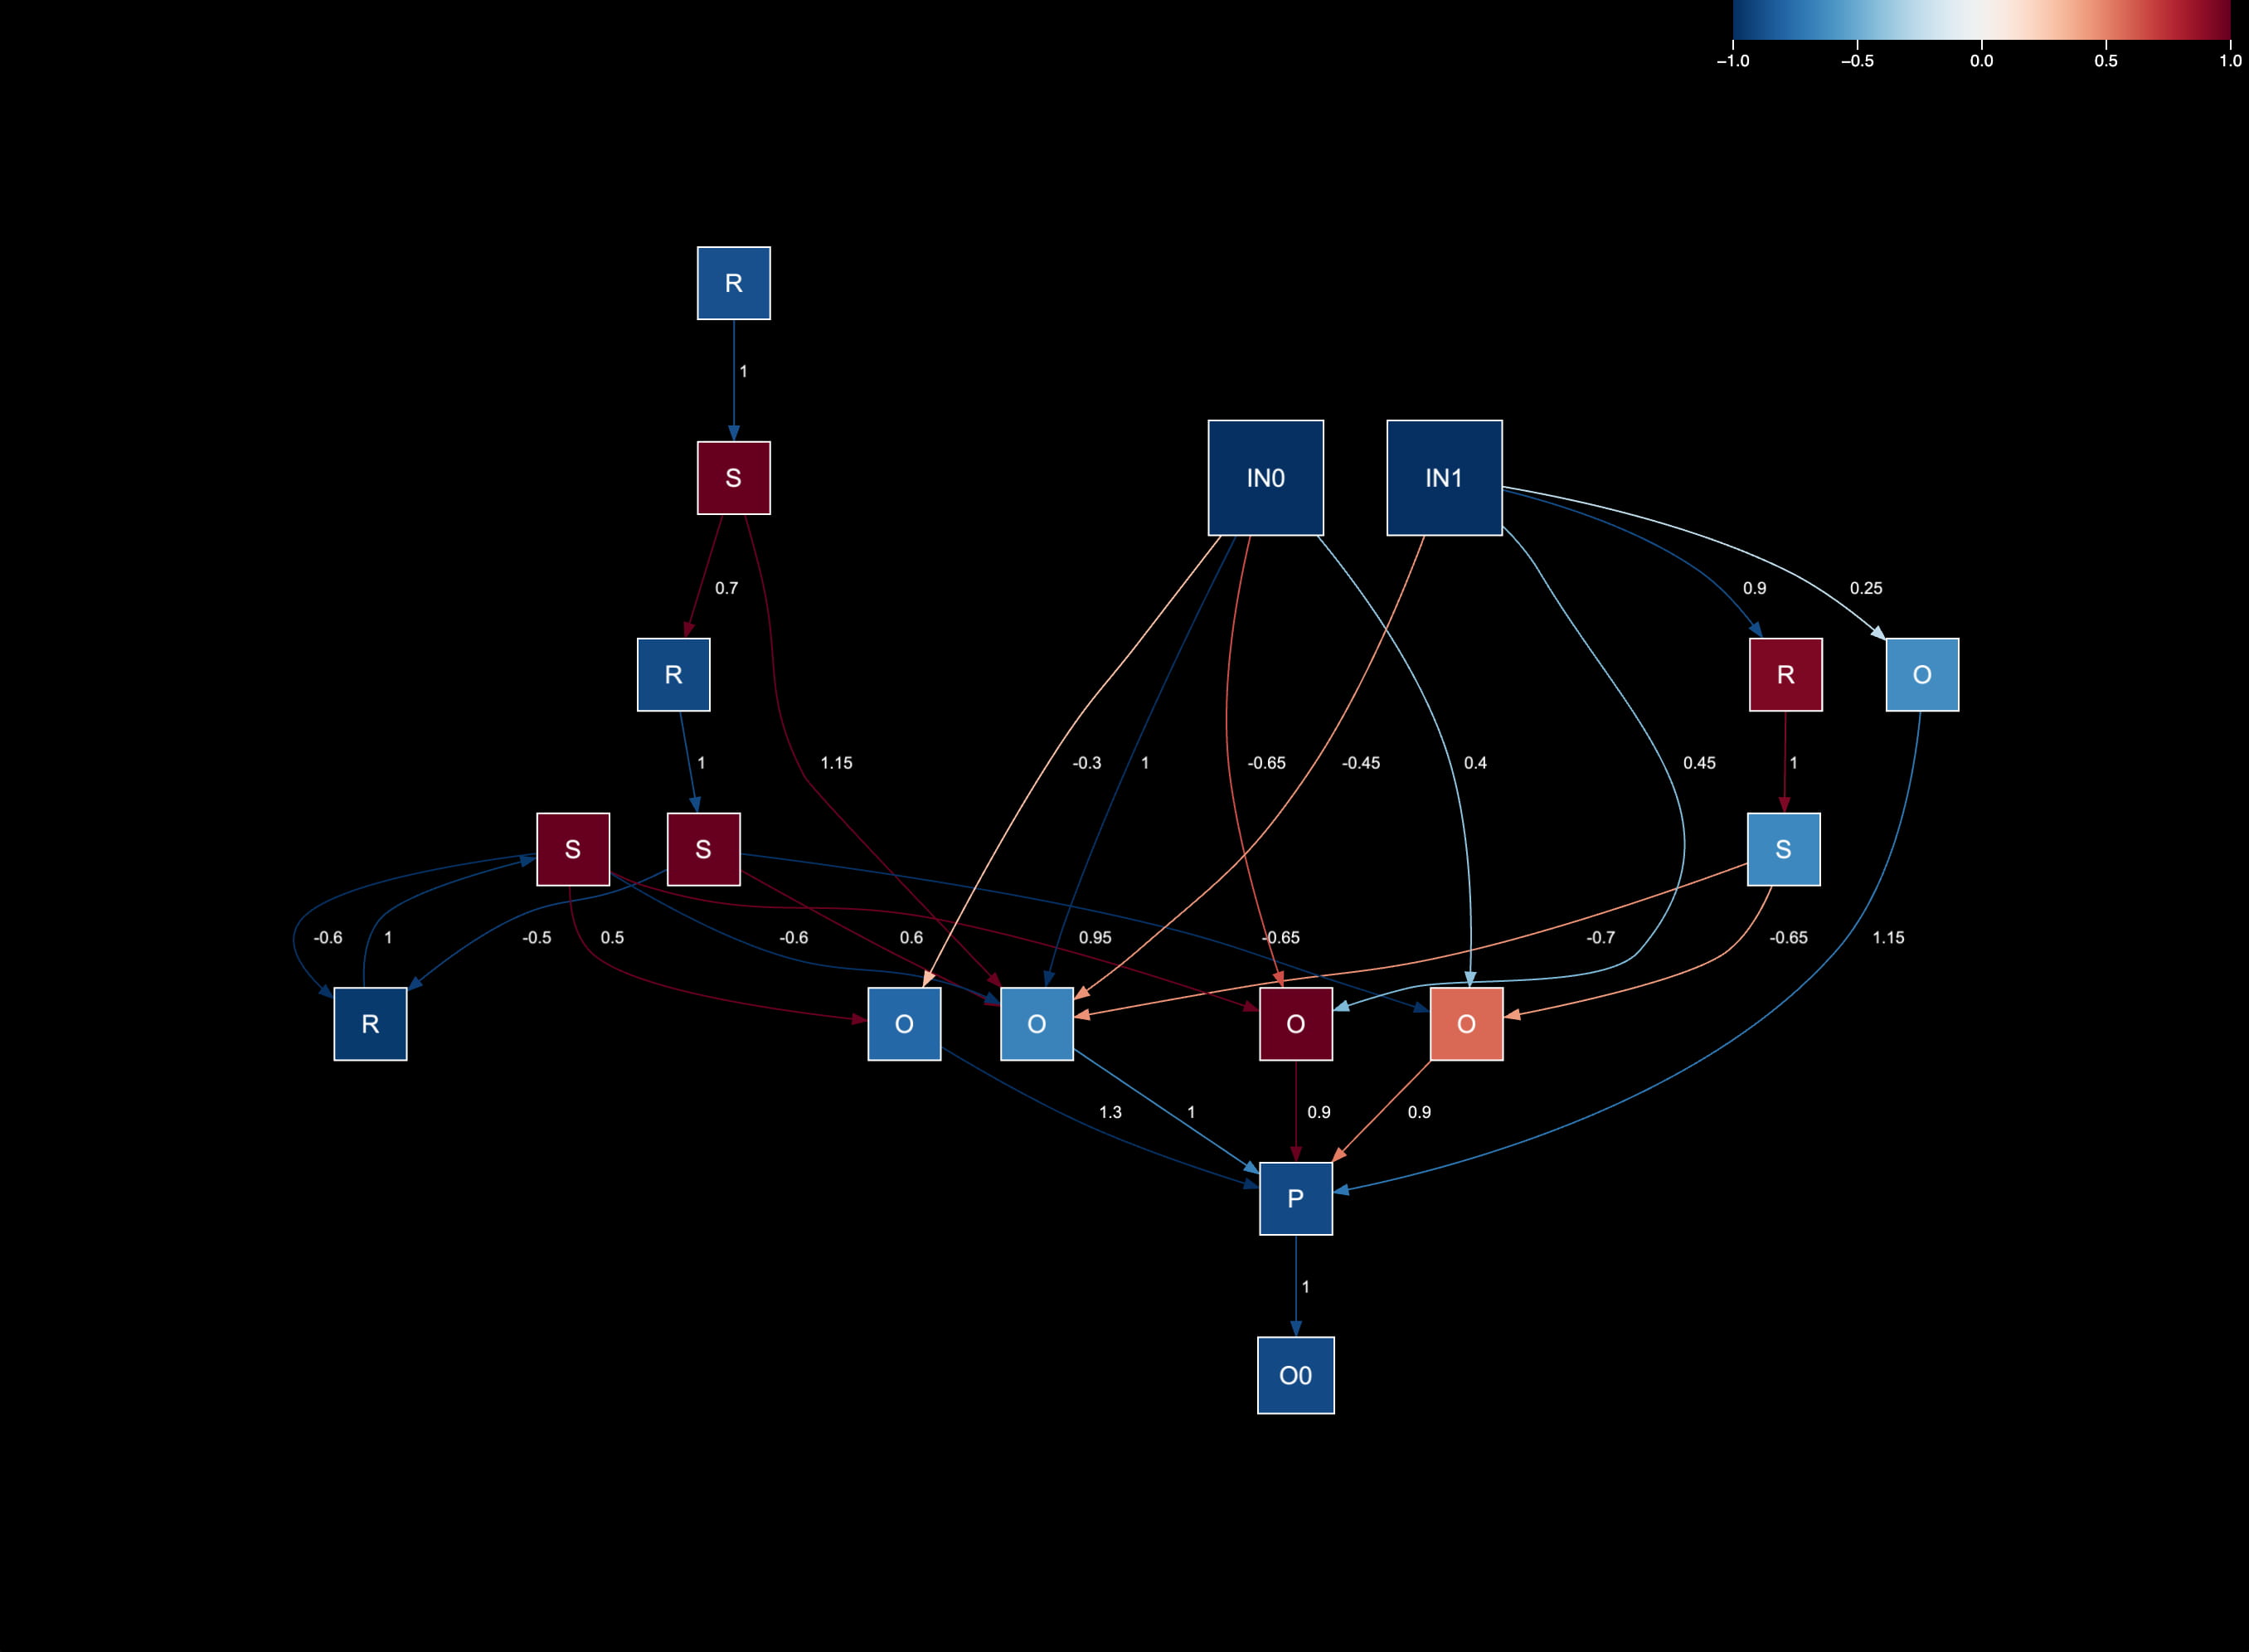
I recently had the need to build a custom renderer for graphs generated by graphviz for a project visualizing computation graphs for RNNs.
Graphviz has an output format called plain and plain-ext which generates a very simple text-based layout specification for all nodes and edges in the input graph. It’s pretty well spec’d out in the official docs for the most part: https://graphviz.org/docs/outputs/plain/.
Here’s an example of what plain-ext output format looks like for a simple graph:
graph 1 5.875 8.3333
node output_0 1.5694 0.47222 1.2604 0.5 output_0 solid ellipse black lightgrey
node layer_0_state_0 1.5694 4.7833 2.0049 0.5 layer_0_state_0 solid ellipse black lightgrey
node layer_0_state_1 3.8194 4.7833 2.0049 0.5 layer_0_state_1 solid ellipse black lightgrey
node layer_0_recurrent_0 1.5694 6.5444 2.4812 0.5 layer_0_recurrent_0 solid ellipse black lightgrey
node layer_0_recurrent_1 4.3056 6.5444 2.4812 0.5 layer_0_recurrent_1 solid ellipse black lightgrey
node layer_0_output_1 1.5694 3.0222 2.1989 0.5 layer_0_output_1 solid ellipse black lightgrey
node post_layer_output_0 1.5694 1.7056 2.5119 0.5 post_layer_output_0 solid ellipse black lightgrey
node input_0 4.3056 7.8611 1.1263 0.5 input_0 solid ellipse black lightgrey
edge layer_0_state_0 layer_0_output_1 4 1.5694 4.531 1.5694 4.2394 1.5694 3.7559 1.5694 3.415 -1 1.6504 3.9028 solid black
edge layer_0_state_1 layer_0_recurrent_0 4 3.5129 5.0233 3.1202 5.3307 2.4377 5.8649 1.9949 6.2114 1 2.8542 5.6639 solid black
edge layer_0_recurrent_0 layer_0_state_0 4 1.5694 6.2921 1.5694 6.0005 1.5694 5.517 1.5694 5.1761 1 1.6181 5.6639 solid black
edge layer_0_recurrent_1 layer_0_state_1 4 4.2359 6.2921 4.155 5.9992 4.0208 5.5127 3.9266 5.1715 1 4.1319 5.6639 solid black
edge layer_0_output_1 post_layer_output_0 4 1.5694 2.7684 1.5694 2.5789 1.5694 2.3165 1.5694 2.0999 -1 1.6504 2.3222 solid black
edge post_layer_output_0 output_0 4 1.5694 1.45 1.5694 1.2819 1.5694 1.0584 1.5694 0.8676 1 1.6181 1.0889 solid black
edge input_0 layer_0_recurrent_1 4 4.3056 7.6072 4.3056 7.4178 4.3056 7.1554 4.3056 6.9388 -1 4.3865 7.2444 solid black
stop
I used graphviz to consume the input graph in native graphviz dot language and then generate plain-ext output text.
Graphviz is an excellent library and largely does a great job creating good-looking graphs. One of the things it handles doing is drawing complex edges that twist and turn to avoid colliding with nodes or labels:

Here’s what the docs page says about the data provided for edge layout:
nis the number of control points defining the B-spline forming the edge. This is followed by 2*n numbers giving the x and y coordinates of the control points in order from tail to head.
I had trouble figuring out how to render these edges with PIXI.JS, the library I was using to build the visualization.
I did some research, and it seems that B-splines a.k.a. Basis Splines are relatives of bezier curves but with more power. They’re able to express curves that bezier curves can’t create on their own.
However, I knew that it was possible to render the edge paths generated by graphviz with just plain bezier curves since that’s what the generated SVGs were using for their paths.
I looked for other solutions, and I only really found one post on Stack Overflow from someone who was able to render them using curveBasis from D3. The D3 source code for that function only really has calls to bezierCurveTo, but they were doing weird things I didn’t understand to compute bezier control points from the spline control points.
Solution⌗
After much more research and trial and error, I figured out how to do it. The list of control points generated by graphviz for each edge spline always totaled 3n + 1 which was a pretty big hint. The first point is the start point of the spline and the last is the end point.
It turns out that the “b-splines” used by graphviz here are quite simple and constrained and in fact are just composed out of a bunch of cubic bezier curves connected together end to end.
So, to render the edge path, all I had to do was move to the starting point of the edge, loop through the points in windows of 3, and draw a bezier curve for each set. The starting point of the next curve is the end point of the last one.
Here’s the code I ended up with to accomplish that:
const start = controlPoints[0];
graphics.moveTo(start.x, start.y);

const startPoint = controlPoints[0];
graphics.moveTo(startPoint.x, startPoint.y);

let p1: Point, p2: Point, p3: Point;
for (let i = 1; i < controlPoints.length; i += 3) {
  p1 = controlPoints[i];
  p2 = controlPoints[i + 1];
  p3 = controlPoints[i + 2];
  graphics.bezierCurveTo(p1.x, p1.y, p2.x, p2.y, p3.x, p3.y);
}
None of those fancy “knot vectors” or other crazy b-spline features are needed at all - just plain old cubic bezier curves.
The results look great and exactly match the SVG generated by graphviz natively!
Drawing Arrowheads⌗
One additional piece that I wanted was arrowheads. My graphs are directed with lots of loops since they represent the computation graphs of RNNs, so knowing the direction of edges was important.
I accomplished this by computing the angle of the last spline at its endpoint where it touches the target node and rendering a triangle pointing in that same direction.
Here’s the code I wrote to do that:
// Computes the direction of the last bezier curve in the spline to determine
// the arrowhead direction
const dx = end.x - prev1.x;
const dy = end.y - prev1.y;
const angle = Math.atan2(dy, dx);

const point1 = {
  x:
    end.x -
    Conf.ArrowheadSize *
      Math.cos(angle - (Math.PI / 6) * Conf.ArrowheadHeightRatio),
  y:
    end.y -
    Conf.ArrowheadSize *
      Math.sin(angle - (Math.PI / 6) * Conf.ArrowheadHeightRatio),
};
const point2 = {
  x:
    end.x -
    Conf.ArrowheadSize *
      Math.cos(angle + (Math.PI / 6) * Conf.ArrowheadHeightRatio),
  y:
    end.y -
    Conf.ArrowheadSize *
      Math.sin(angle + (Math.PI / 6) * Conf.ArrowheadHeightRatio),
};

graphics.lineStyle(1, color);
graphics.beginFill(color);
graphics.drawPolygon([end.x, end.y, point1.x, point1.y, point2.x, point2.y]);
graphics.endFill();
It works well, and the arrowheads look good! Note that config option used to elongate the triangles for the arrowheads a bit so that they are longer since equilateral triangles looked too fat.
That’s all! I hope this ends up helping someone out doing something similar in the future.