Trying Out Cloudflare's `foundations` Library for Rust

A couple of months ago, I happened across the announcement blog post from Cloudflare for their newly released foundations library for Rust. It looked like something I'd definitely be interested in using, and I mentally marked it down as something to check out when a good opportunity came up.
Well, that opportunity recently came around - so I went ahead and tried it out!
I set up a small, self-contained, greenfield Rust project from scratch built with foundations from the very beginning. That service is now running in production, and I feel like I can give some informed thoughts about foundations and what it's like to use it in practice.
Background + Overview
foundations is a modular set of tools and utilities for building networked services/microservices in Rust.
The idea is to provide a re-usable and common toolkit containing the common pieces of functionality you'll need again and again when building server-side applications in Rust. These include features like logging, metrics, tracing, security, settings, and more - a full list is available in their well-written docs. There are a few modules that have some support for working on the client side, but largely the focus is on server-side applications.
Here's the list they give in their own docs:
- logging
- distributed tracing
- metrics
- memory profiling and jemalloc allocator
- security features, such as seccomp-based syscall sandboxing
- service configuration with documentation
- CLI helper that takes care of the configuration loading
Rather than providing a monolithic application platform or protocol-specific framework, its features are mostly independent and are set up individually by the programmer. There's nothing in foundations for things like HTTP servers or gRPC endpoints; it's all a bit more generic than that.
Initial Impressions + Observations
One of the first things I noticed while using this library was that
foundations really is extremely modular and doesn't lie about being incrementally adoptable in existing codebases.
Every individual piece of functionality in the library is neatly split up and exposed behind a variety of well-documented feature flags. I opted to disable all the default features and explicitly opt-in to all the functionality I wanted one by one. While doing this, I was impressed by how I ran into no compilation issues or other problems while setting it up.
I've worked with feature-flagged code in Rust in the past, and it's very easy to introduce compilation failures or incompatibilities with certain combinations of flags. foundations has theirs set up very well, though, and I experienced no such issues at all.
foundations seems somewhat slanted towards enterprise use-cases compared to standalone applications or side projects.
Some of the features like tracing, syscall sandboxing, and others are mostly useful for larger dev teams maintaining dozens-hundreds of services. This isn't that surprising since it's built by Cloudflare, originally for use in their Oxy proxy service.
That being said, I think foundations is still very useful for smaller projects or solo developers (like I was for my project). The previously mentioned modularity means you if one of the features isn't useful to you, you can easily choose to just not use it.
Settings + CLI
One of the first things I set up with foundations was its settings file support. This is for runtime parameters and application-specific config values. foundations handles auto-generating a YAML file from your settings spec that will be loaded at runtime.
The code for setting that up for my application looks like this:
use foundations::{settings::settings, telemetry::settings::TelemetrySettings};

#[settings]
pub(crate) struct ServerSettings {
  /// Telemetry settings.
  pub(crate) telemetry: TelemetrySettings,

  /// Port that the HTTP server will listen on.
  #[serde(default = "default_u16::<4510>")]
  pub port: u16,
  /// Osu! OAuth client ID
  pub osu_client_id: u32,
  /// Osu! OAuth client secret
  pub osu_client_secret: String,
}
That generates a YAML file that looks like this:
---
# Telemetry settings.
telemetry:
  # <... many auto-generated settings for `foundations` telemetry ...>
# Port that the HTTP server will listen on.
port: 4510
# Osu! OAuth client ID
osu_client_id: 0
# Osu! OAuth client secret
osu_client_secret: ""
Overall, it all made sense and setting it up was straightforward. As you can see, I had quite minimal needs for settings for my application, and it all worked as expected out of the box.
It makes use of serde, so all of the settings must be de/serializable. This also leads to my main complaint about the settings module:
For many settings, I ended up pulling in a helper crate called serde_default_utils to accomplish that. Another option is to manually implement Default for your settings struct and provide defaults for all fields explicitly.
The only other complaint I had is that
This is more of an opinion, and I know there are people out there that dislike the use of environment variables for application config, but I personally find that it's often a very useful feature to have.
There's an open issue suggesting adding support for environment variable support in settings, and the library authors seem open to adding it, so there's a decent chance this support will come in the future.
Telemetry
This is where things get kind of messy, but it's not really the fault of foundations.
Logging
Internally, foundations uses slog to manage its logging. Calls to foundations::telemetry::log::info!() and similar functions emit calls to the slog logger that foundations maintains under the hood.
slog has a lot of fancy features like expanded logging macros, support for forkable loggers, and a bunch of other complex features I don't fully understand. It seems very well thought out and comprehensive.
foundations works quite well on its own.
However, slog is not the only logging facade available in the Rust ecosystem. The main alternatives that I'm familiar are log and tracing from the Tokio ecosystem.
These different libraries are not compatible with each other by default. Libraries that are set up to log with log (also called stdlog) will have their log messages go into the void if a project has been configured with a different logger.
There are various adaptor crates available like tracing-slog for slog->tracing, slog-stdlog for log<->slog, tracing-log for log->tracing, etc.
For my project, my logging needs were very simple. I had an extremely minimal axum webserver with a single route that I wanted to log requests/responses for. The idiomatic way to do that seems to be to add a TraceLayer, which logs using tracing.
I spent a bunch of time trying to tweak the TraceLayer to work with the slog logger from foundations without luck. I then tried to set up a shim to send logs from tracing::info!() etc. to foundations, but couldn't get that to work either.
I'm sure there's some arcane adapter library and config option that could make this work, but it was such a massive waste of time for this project that I decided to just drop foundations logging support and do all the logging myself with tracing and tracing-subscriber to get it to print to the console.
Although this part of the project was very annoying, I blame the pain on the fragmentation of the logging ecosystem rather than on some design flaw of foundations. And at the end of the day, it was very easy to just turn off the logging features of foundations and handle that myself.
It looks like there are future plans to add support for funneling events from tracing into foundations, but those aren't implemented yet. If that support lands, I expect it will greatly improve this situation.
Metrics
foundations.
I'd never set up a proper metrics collection system in any of my projects previously, but I felt it was a good time to do it for this one in order to try out as much of foundations as possible.
The metrics functionality in foundations is focused around providing data in the format ingested by Prometheus - the most popular and commonly used open source metrics + monitoring solution out there right now.
I actually went ahead and set up a self-hosted Prometheus and Grafana instance myself running inside Docker. To my surprise, that process was actually much easier than I expected, and it only took a few hours.
To start, foundations provides a nice macro to define a set of metrics collectors for your application. These can be things like event counters, latency histograms, or gauges to track values over time.
Defining a new metric is as easy as this:
#[metrics]
pub(crate) mod http_server {
  /// Number of HTTP requests.
  pub fn requests_total(endpoint_name: &'static str) -> Counter;
}
Recording values is very easy as well:
http_server::requests_total("get_hiscores").inc();I defined a variety of metrics for my application, mostly to track HTTP response times and request counts of the API I was proxying requests to.
foundations handles all the bookkeeping for the various metrics, collating them into the format Prometheus understands, and exposing that on a HTTP server so they can be collected. The docs were all excellent and made setting this up quite easy.
foundations are excellent and easy to set up.
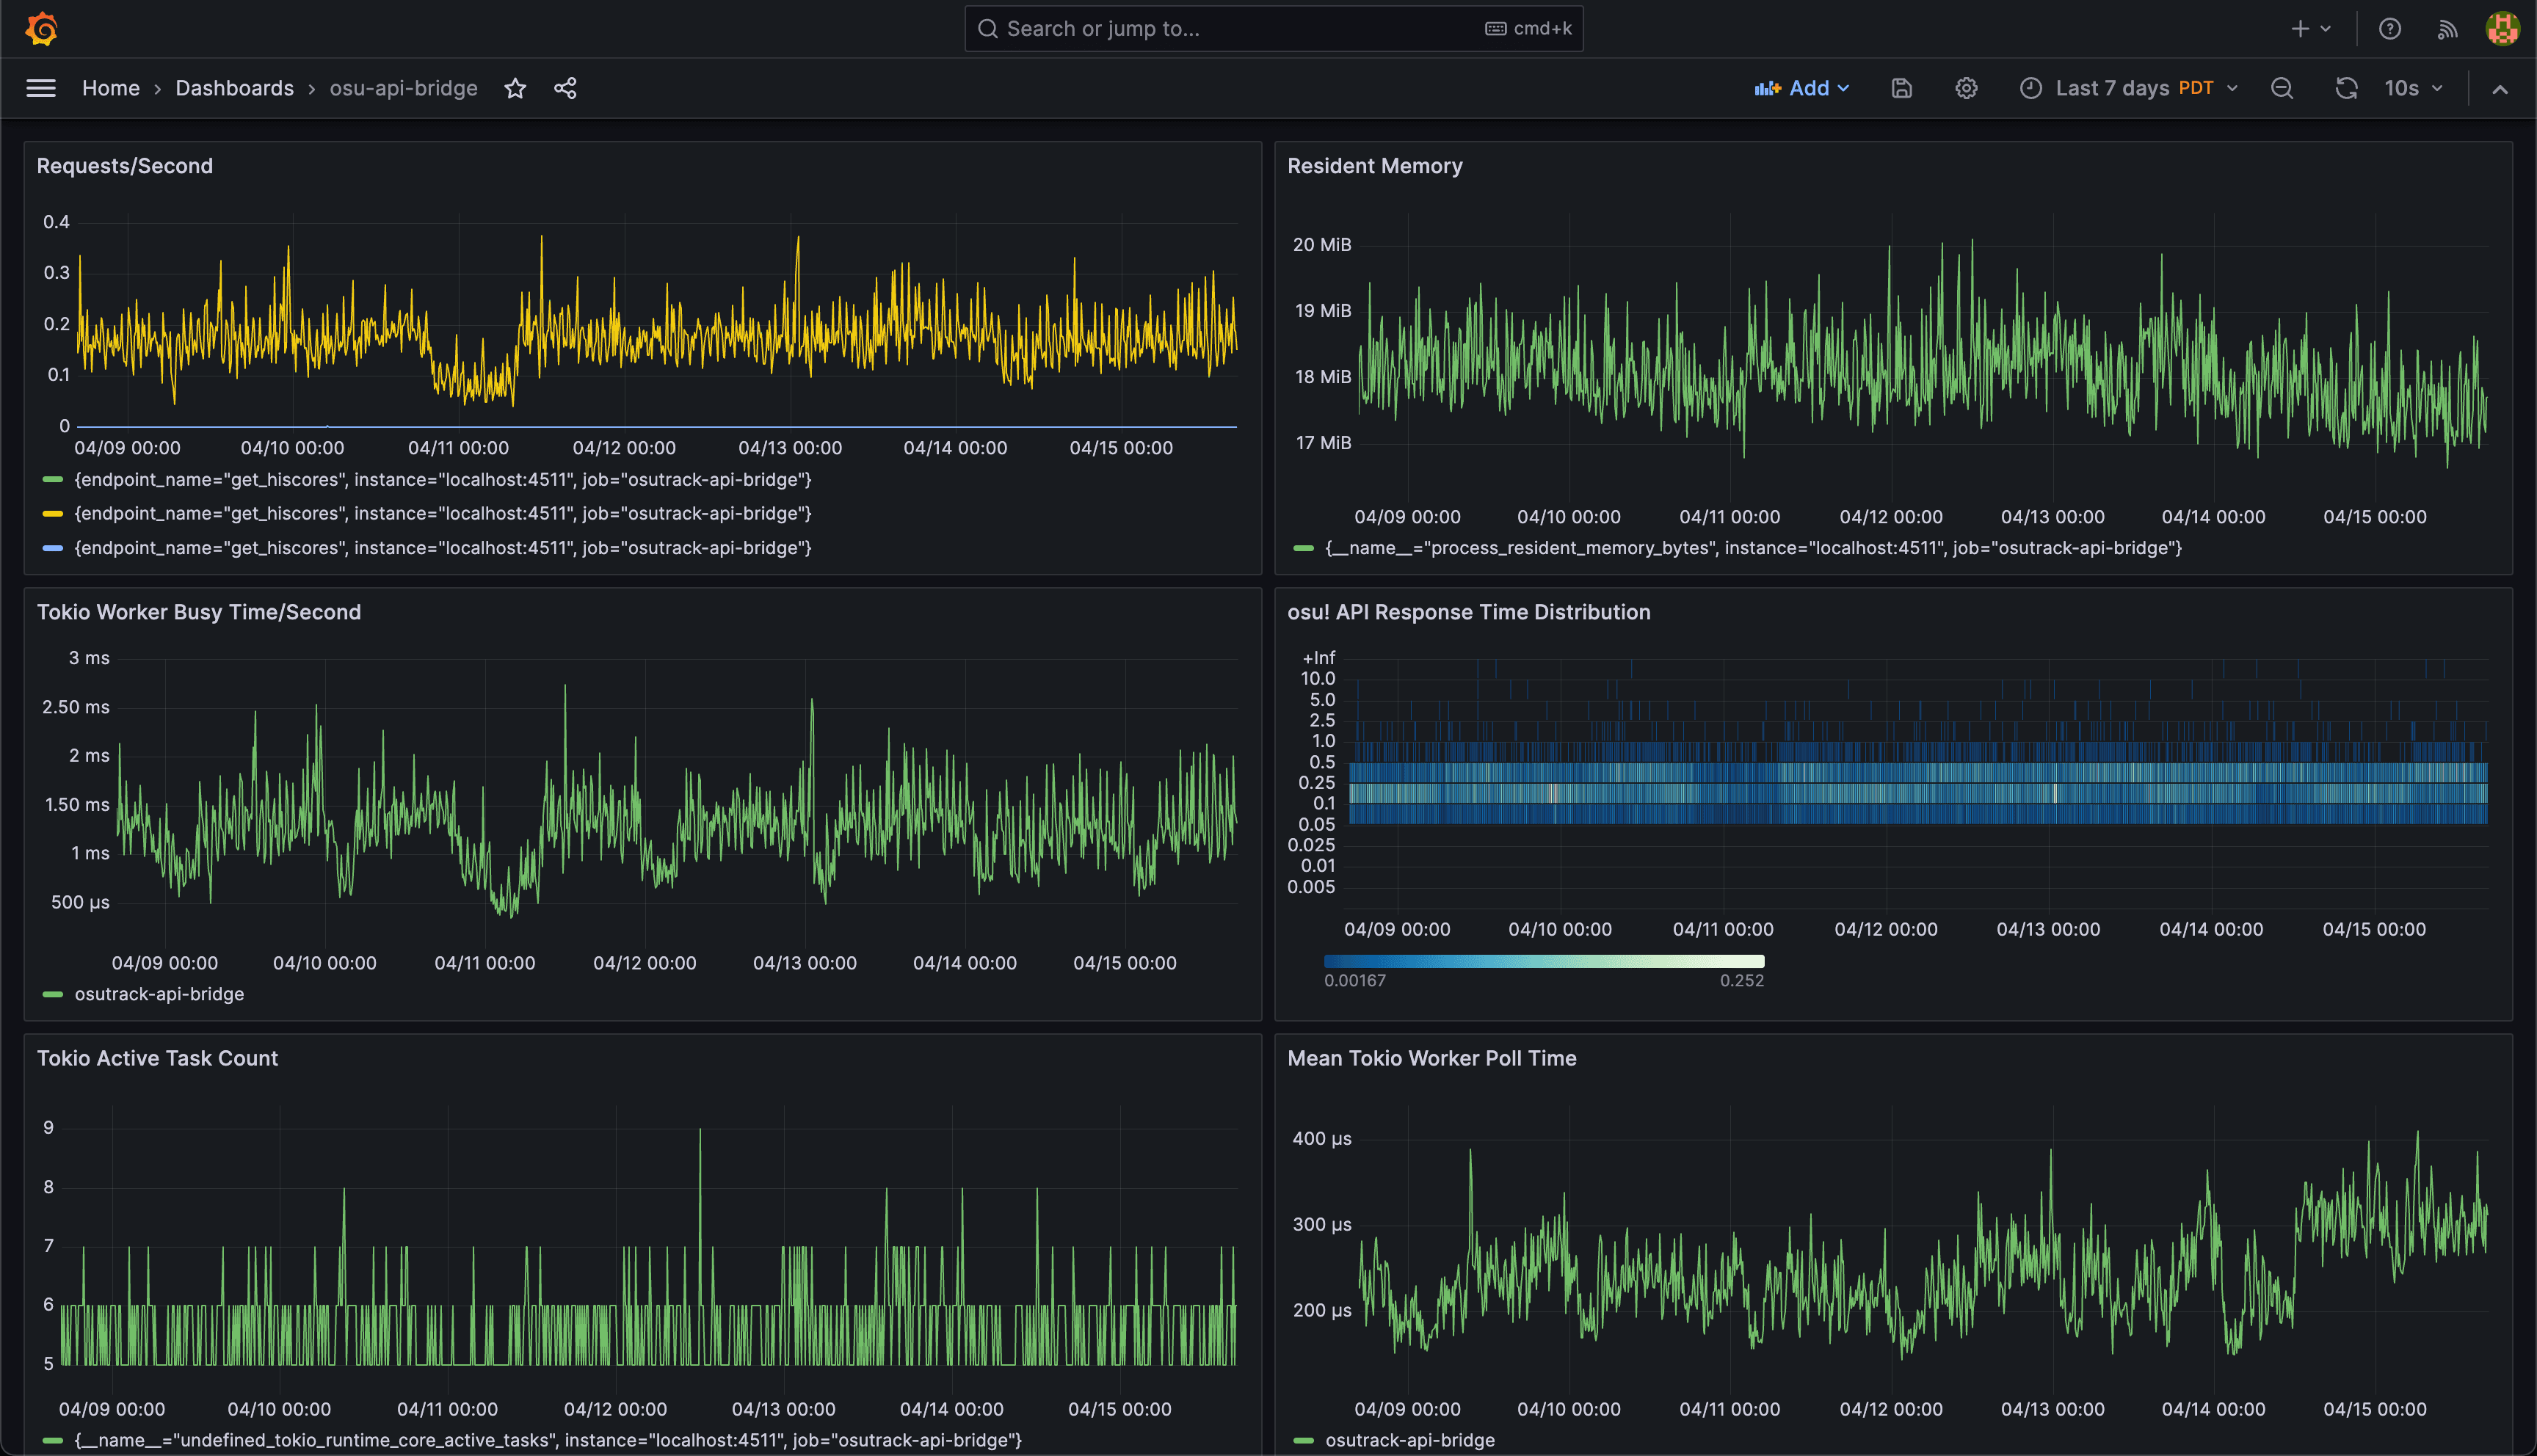
Advanced Tokio Metrics
In addition to manually-defined metrics for specific applications, foundations also provides support for exposing internal metrics for Tokio. You currently have to set some special RUSTFLAGS and use the nightly Rust compiler, but setting it up wasn't too much of a hassle overall.
In return, you get really deep and interesting insights into the Tokio runtime itself. I created graphs of some of these in Grafana and added them to the dashboard:
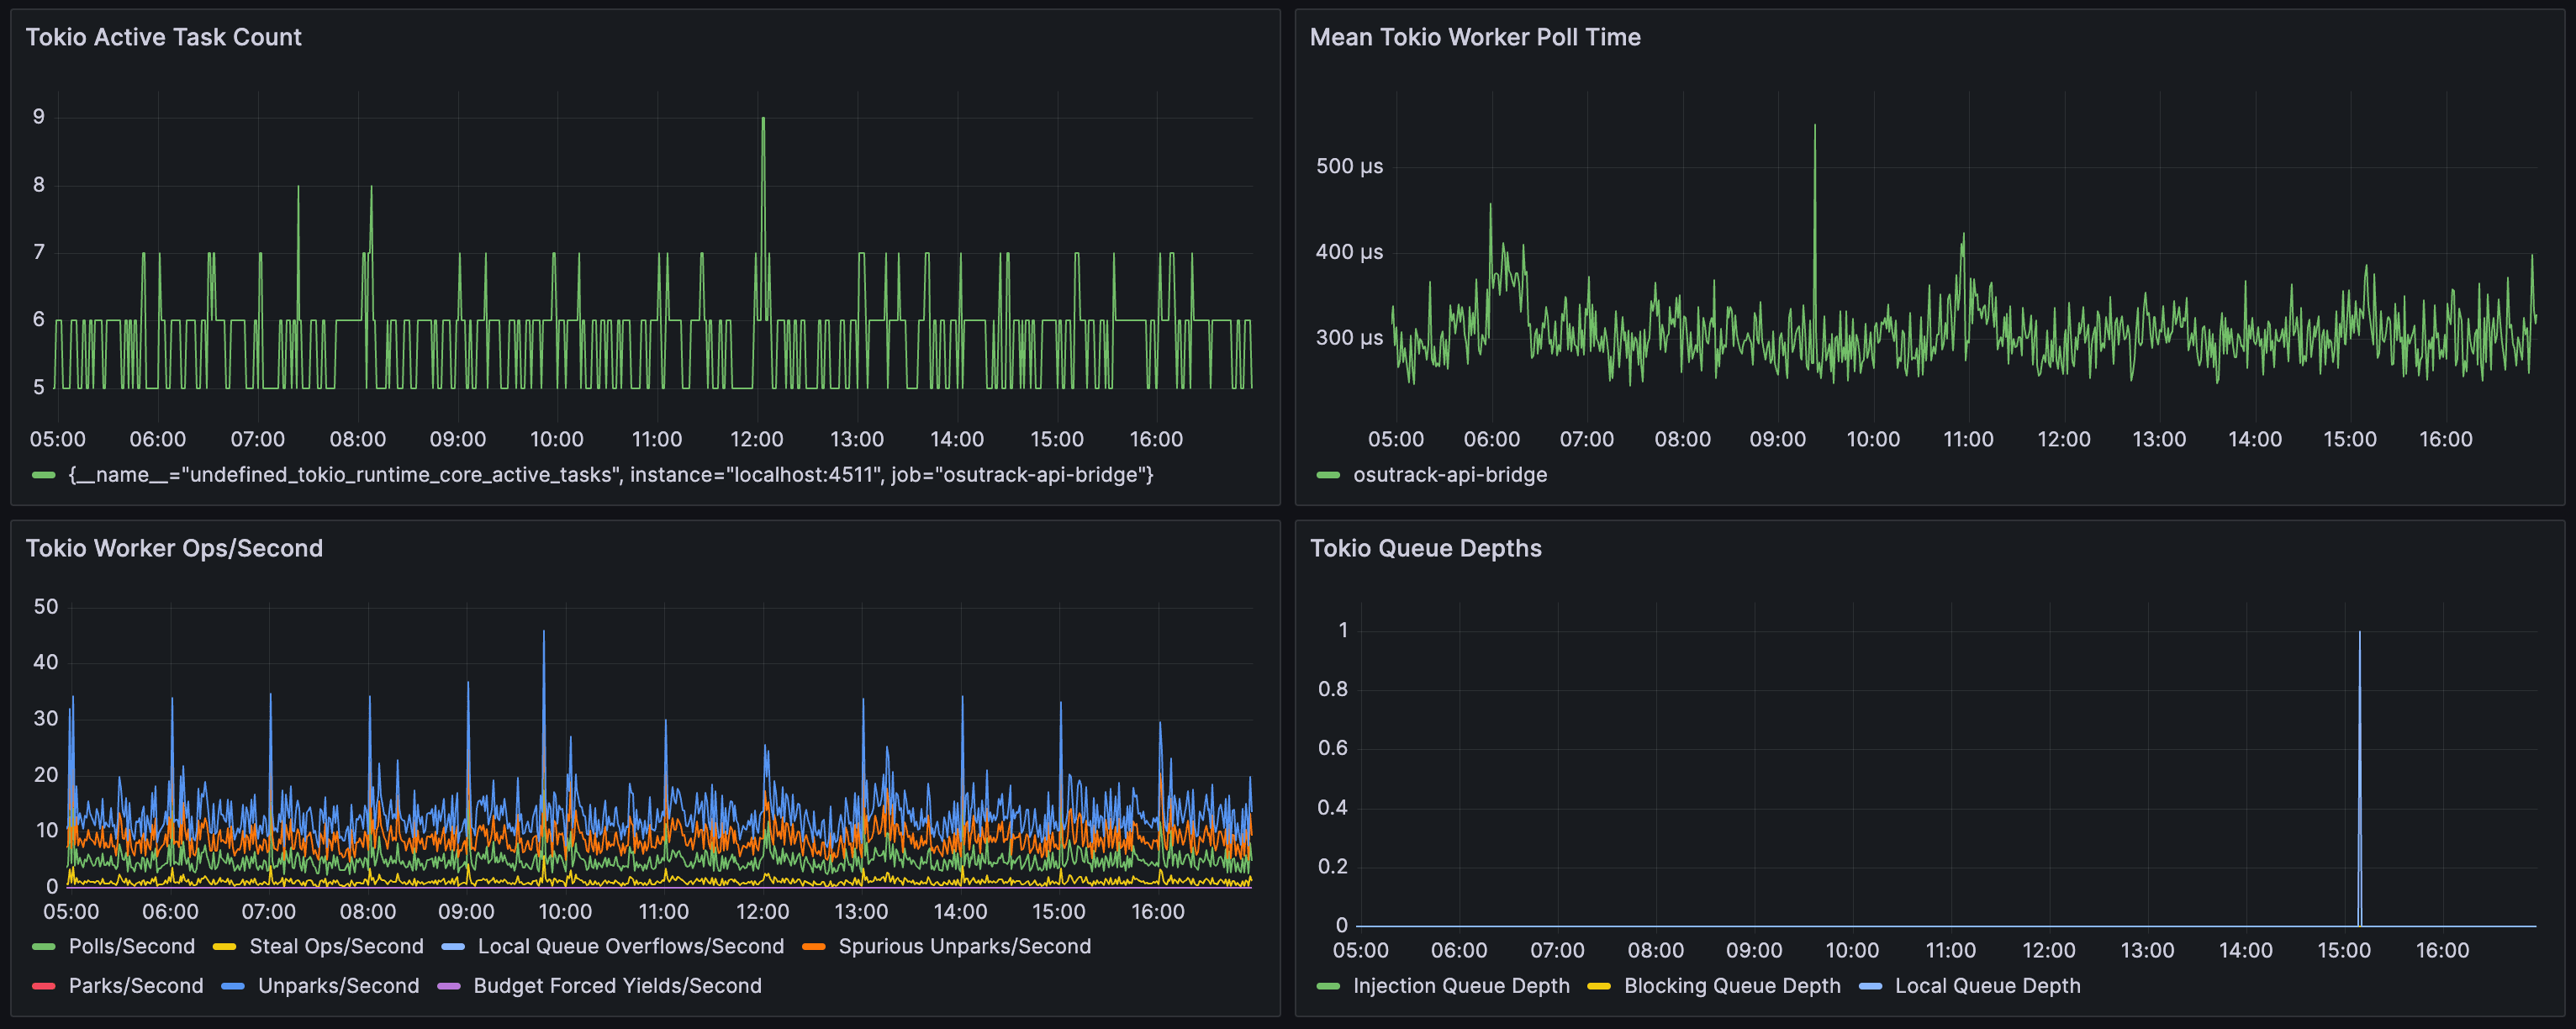
Since my API bridge is so simple, there's not a lot of deep info to be gleaned from these currently. But for applications with more complex use-cases which make use of more advanced Tokio features, I could easily see these metrics being invaluable for diagnosing performance issues or spotting issues.
Tracing
In addition to logging, foundations also has support for tracing that works with Jaeger. This includes advanced features like cross-service trace stitching, forked tracing, and other fancy stuff like that.
I took a brief look into setting up Jaeger, but I quickly came to realize something:
This is something that I could see being extremely useful for an enterprise running dozens of interconnected services across multiple teams, but it's way overkill here. Because of that, I didn't try out the tracing features of foundations myself.
jemalloc
jemalloc is a powerful memory allocator which has many benefits compared to the system allocator. It used to be included in Rust by default, but was eventually removed to lighten the binary size among other reasons.
Besides being a highly performant allocator, jemalloc is notable for its efficiency in long-running services. It's one of the best allocators are reducing memory fragmentation, and I've anecdotally found that it's much better at other at returning unused memory to the operating system over time. I've run into issues in the past where the system allocator would hold onto unused pages indefinitely after a temporary burst in usage, while jemalloc seems to do a good job at releasing them.
I often end up adding jemalloc manually to my projects for these reasons, so it's great that foundations offers out-of-the-box support for it.
Other Features
There were a few other components of foundations that I didn't try out myself.
The main one is syscall sandboxing for security. Although this is obviously a very powerful tool for applications with strict security needs, there's just no need for that for mine.
I also didn't try out the advanced memory profiling support through jemalloc. That's something I could see myself using down the road, though.
Conclusion
foundations. I plan to include it by default in all new Rust services I create in the future.
Since starting this blog post, I've set up foundations in two additional Rust services - one new and one old. The process was largely very smooth, although I did run into similar issues with logging via the tracing crate as I mentioned.
I found that foundations delivers on all of its claims an promises for functionality, modularity, and its ability to be incrementally adopted in existing codebases without undue effort.
As an added bonus, it gave me the push I needed to go ahead and set up a real modern metrics + analytics system with Prometheus and Grafana for my services.
The Future
foundations has going for it is that it's actively used at Cloudflare in some of their core services.
As a result, it gets regular updates and active maintenance by their world-class engineering team.
Compared to other libraries out there, I feel much more confident that foundations won't just vanish or randomly go unmaintained one day.