Debugging a Hanging Apache2 Server on the Fly

Yesterday, I made a comment on Reddit that included a link to a screenshot I took using my personal screenshot hoster application. The comment was in a very active /r/worldnews thread about the Iranian missile attacks against US military bases, and it soon picked up a lot of steam. Within an hour after posting, I was getting hundreds of requests per minute to the image from Reddit users and of course my eyes were glued to the Apache2 server log watching the delightful traffic stream through.
However, not long after that, I realized that all of my other websites hosted on that same Apache2 server were starting to take a long time to load - a really long time. Worse yet, the image itself was basically inaccessible with load times orders of magnitude higher than the ~1 second most Reddit users would be willing to wait before giving up and moving on. That made no sense; even on my relatively modest VPS, serving a single ~400KB image should take negligible resources, even with hundreds of requests per second.
So, panicked with hundreds of karma on the line, I dove in to try to figure out what the issue was. The first thing I did was the obvious action of restarting everything, so I service apache2 restart'd and also restarted the NodeJS screenshot hoster application that sat behind Apache via a reverse proxy. I was pretty convinced that it wasn't the Node app that was causing issues since I was able to hit it locally via curl from the VPS without any delay, but I figured it couldn't hurt. This fixed things for a small bit of time, but within 30 seconds all requests to the server were back to hanging for dozens of seconds before responding.
I looked at resource consumption on the server and saw nothing alarming - CPU usage was below 10% and memory wasn't near exhaustion. I checked /var/log/apache2/error.log to see if there were any obvious clues as to what the problem was, but the only thing I saw were thousands of messages about connections getting closed unexpectedly due to users giving up loading the image.
I had a random thought that maybe it was a lack of file descriptors since my process list was full of more apache2 worker processes than I'd ever seen before. I tried bumping the limit with ulimit, but I wasn't even sure I was doing it correctly and nothing seemed to change. Plus, I imagined there would be some notice of that in the error log and grepping for file descriptor and several variants yielded nothing.
The next thing I did was disable mod_pagespeed, a recent addition to my server that I imagined might be causing some kind of bottleneck due to the cache being out of memory or something similar. However, after disabling it and restarting the server, the issue came back almost immediately.
Suddenly, I had what felt like a stroke of genius as I remembered reading some blog posts about entropy exhaustion on Linux VPS's that had few sources of randomness with which to populate /dev/random. It seemed like the perfect culprit: Everything I tried to load displayed "Performing a TLS Handshake with ..." in the bottom bar of the browser which I imagined could be due to the server blocking while waiting for entropy with which to generate the encryption keys for the connection.
I tried to install two different RNG-generation daemons, rngd and haveged, but unfortunately neither one works with the OpenVZ hypervisor within which my VPS runs. The only other solution I could think of was switching from "blocking" RNG of /dev/random to the non-blocking PRNG of /dev/urandom. I didn't know the details of what Apache2 was doing under the hood to generate its RNG, but I figured it was worth a shot. After a bit of Googling, I found the spot in the Apache2 conf where I could specify where it pulls its randomness. I changed it from /dev/random to /dev/urandom:
 SSLRandomSeed startup builtin
-SSLRandomSeed startup file:/dev/random 512
+SSLRandomSeed startup file:/dev/urandom 512
 SSLRandomSeed connect builtin
 SSLRandomSeed connect file:/dev/urandom 512
Crossing my fingers, I refreshed the image over and over, hoping for the immediate loads to continue. Unfortunately, the hangs started again after a few seconds. To confirm that the entropy idea was wrong, I tried requesting the file locally on the server via HTTP, avoiding any need for TLS handshakes or entropy generation, and saw that hung as well. The issue definitely wasn't TLS-related.
At this point, I was getting desperate and quite frustrated. I had been convinced that it was something to do with the TLS connections/handshakes, but none of my efforts had any effect. In an attempt to figure out more exactly which part of the request was taking so long, I pulled up Firefox dev tools and looked at the network timings for the request. Although I sadly don't have a screenshot from the actual timings for that request, this is what the visualization looks like:
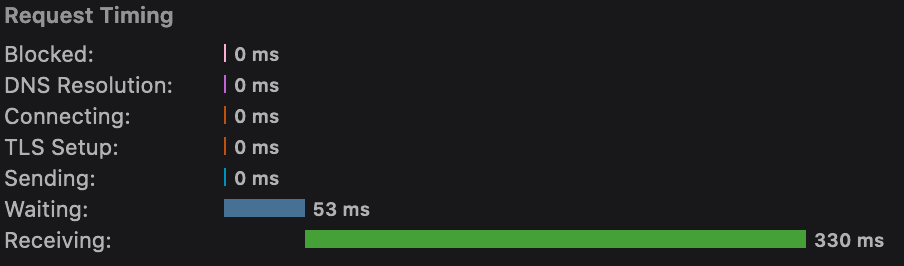
In the case of my request for the uploaded screenshot, both the "Blocked" and "TLS Setup" bars had almost exactly 30 seconds each. I found that very strange and refreshed. The same exact timings, bar a few dozen milliseconds, showed up again!
That felt like a really notable thing; it seemed like some kind of internal request was waiting to time out before the response was let through to the client. I crafted a Google search query of "apache2 requests taking exactly 1 minute" which led me to this groundbreaking Unix StackExchange question: Apache Request Hangs For 2 Minutes Exactly
The top answer said it was possibly due to reverse DNS lookups being performed on the IP of the client connecting to the server, and it linked to a Serverfault question that was asked 10 years ago: Apache httpd won't stop doing reverse DNS requests for clients' IPs
And there's where I found my solution. The default configuration of my Apache2 installation contains settings that use %h in its logging formatting. %h corresponds to hostname and apparently has the behavior of performing reverse DNS requests for all connecting client IPs. Due to some other configuration issue on my VPS or with the DNS server it was using, these were apparently failing with a 30-second timeout twice per request, causing all of them to take one minute to respond.
I took the suggested action of changing %h to %a in all of my LogFormat config directives:
-LogFormat "%v:%p %h %l %u %t \"%r\" %>s %O \"%{Referer}i\" \"%{User-Agent}i\"" vhost_combined
-LogFormat "%h %l %u %t \"%r\" %>s %O \"%{Referer}i\" \"%{User-Agent}i\"" combined
-LogFormat "%h %l %u %t \"%r\" %>s %O" common
+LogFormat "%v:%p %a %l %u %t \"%r\" %>s %O \"%{Referer}i\" \"%{User-Agent}i\"" vhost_combined
+LogFormat "%a %l %u %t \"%r\" %>s %O \"%{Referer}i\" \"%{User-Agent}i\"" combined
+LogFormat "%a %l %u %t \"%r\" %>s %O" common
I then rebooted the server and happily saw all of my responses stay in the ~100 millisecond range including downloading the full 400KB image. I still don't know why exactly this problem only manifested when my server was getting many requests (I've never seen this before in years of the server running), why these reverse DNS resolutions were happening despite not showing up in the logs, or why code in the logging path was causing the main requests to be blocked, but my webserver went on to happily serve well over 50,000 views and counting to the image after applying the fix.